2022 ATB data for geothermal are shown above. The base year hydrothermal costs are derived from actual geothermal power plant data. Near term enhanced geothermal system (EGS) costs are predictions for a package of technologies currently under development and have no calibration to actual project deployment, as at this time none exists. The future cost projections use bottom-up models derived from the analysis and results of the GeoVision: Harnessing the Heat Beneath our Feet report (DOE, 2019). The GeoVision analysis is a collaborative multiyear effort with contributors from industry, academia, national laboratories, and federal agencies. The GeoVision report updates resource potential estimates as well as recently published and projected capital and operation and maintenance (O&M) costs through evaluation of recent industry trends. It also predicted advancements in areas such as drilling efficiency and materials and EGS stimulation success. Drilling and EGS improvements enable reduced development timelines, CAPEX , and financing rates.
The National Renewable Energy Laboratory (NREL)-published 2021 U.S. Geothermal Power Production and District Heating Market Report confirms many of the industry trends reported in GeoVision (Robins et al., 2021). The base year hydrothermal LCOEs fall within the bounds of other publications and recent geothermal power purchase agreements. In addition, the market report confirmed that although EGS is not yet economical, technical progress continues to be made on the Frontier Observatory for Research in Geothermal Energy (FORGE) initiative. The terms for public geothermal power purchase agreements signed from November 2019 through September 2020 can be found in the table below (Robins et al., 2021).
Recent Public Geothermal Power Purchase Agreement Pricing
| Project | State | Size (MW) | Pricing ($/MWh) | Term (years) |
|---|---|---|---|---|
| Hell’s Kitchen | California | 40 | 74 | 25 |
| Whitegrass | Nevada | 3 | 67.50 | 25 |
| Star Peak | Nevada | 12.5 | 70.25 | 25 |
| Casa Diablo | California | 16 | 68 | 20 |
| Puna | Hawaii | 46 | 70 | 30 |
The three scenarios for technology innovation are:
Within the 2022 ATB, geothermal resources broadly consist of two main types: hydrothermal and enhanced geothermal systems (EGS). Hydrothermal systems are naturally occurring zones of Earth-heated circulating fluid that can be exploited for electricity generation if certain minimum temperatures and flow rates are achieved for a given power plant technology. EGS exhibit naturally occurring zones of heat but lack sufficient fluid flow and require engineering to enhance permeability. These two resource types are then subdivided based on site specific resource characteristics and compatible power plant technology into two types of energy conversion processes used to generate geothermal electricity:
Hybrid plants, or a combination of binary and flash systems. Are employed in some locations but are not modeled here.
Examples using these plant types in each of the three resource categories (hydrothermal, NF-EGS, and deep EGS) are shown in the ATB.
Geothermal Resource and Cost Characteristics
| Technology | Temp (°C) | >=200C | 150–200 | 135–150 | |
|---|---|---|---|---|---|
| Hydrothermal | Number of identified sites | 21 | 22 | 17 | 59 |
| Total capacity (MW) | 15,338 | 2,991 | 820 | 4,759 | |
| Average overnight capital cost, or OCC ($/kW) | 4,156 | 8,639 | 9,287 | 17,060 | |
| Min OCC ($/kW) | 2,908 | 4,400 | 7,358 | 11,574 | |
| Max OCC ($/kW) | 5,942 | 37,049 | 11,531 | 25,934 | |
| Example of plant OCC ($/kW) | 4,498 | 5,760 | N/A | ||
| NF-EGS | Number of sites | 12 | 20 | ||
| Total capacity (MW) | 787 | 596 | |||
| Average OCC ($/kW) | 10,751 | 27,105 | |||
| Min OCC ($/kW) | 8,668 | 18,896 | |||
| Max OCC ($/kW) | 14,939 | 41,506 | |||
| Example of plant OCC ($/kW) | 13,966 | 32,255 | |||
| Deep EGS (3–6 km) | Number of sites | N/A | N/A | N/A | |
| Total capacity (MW) | 100,000+ | ||||
| Average OCC ($/kW) | 26,377 | 60,203 | |||
| Min OCC ($/kW) | 17,822 | 29,699 | |||
| Max OCC ($/kW) | 41,002 | 111,998 | |||
| Example of plant OCC ($/kW) | 13,966 | 32,255 | |||
OCC: overnight capital cost
The hydrothermal geothermal resource potential is concentrated in the western United States. The total mean potential estimated by the U.S. Geological Survey (USGS) in 2008 is 39,090 MW: 9,057 MW identified and 30,033 MW undiscovered (USGS, 2008). The resource potential identified at each site is based on available reservoir thermal energy information from studies conducted at the site (USGS, 2008). The undiscovered hydrothermal resource estimate is based on a series of geographic information system statistical models of the spatial correlation of geological factors that facilitate the formation of geothermal systems.
The USGS resource potential estimates for hydrothermal are used with the following modifications:
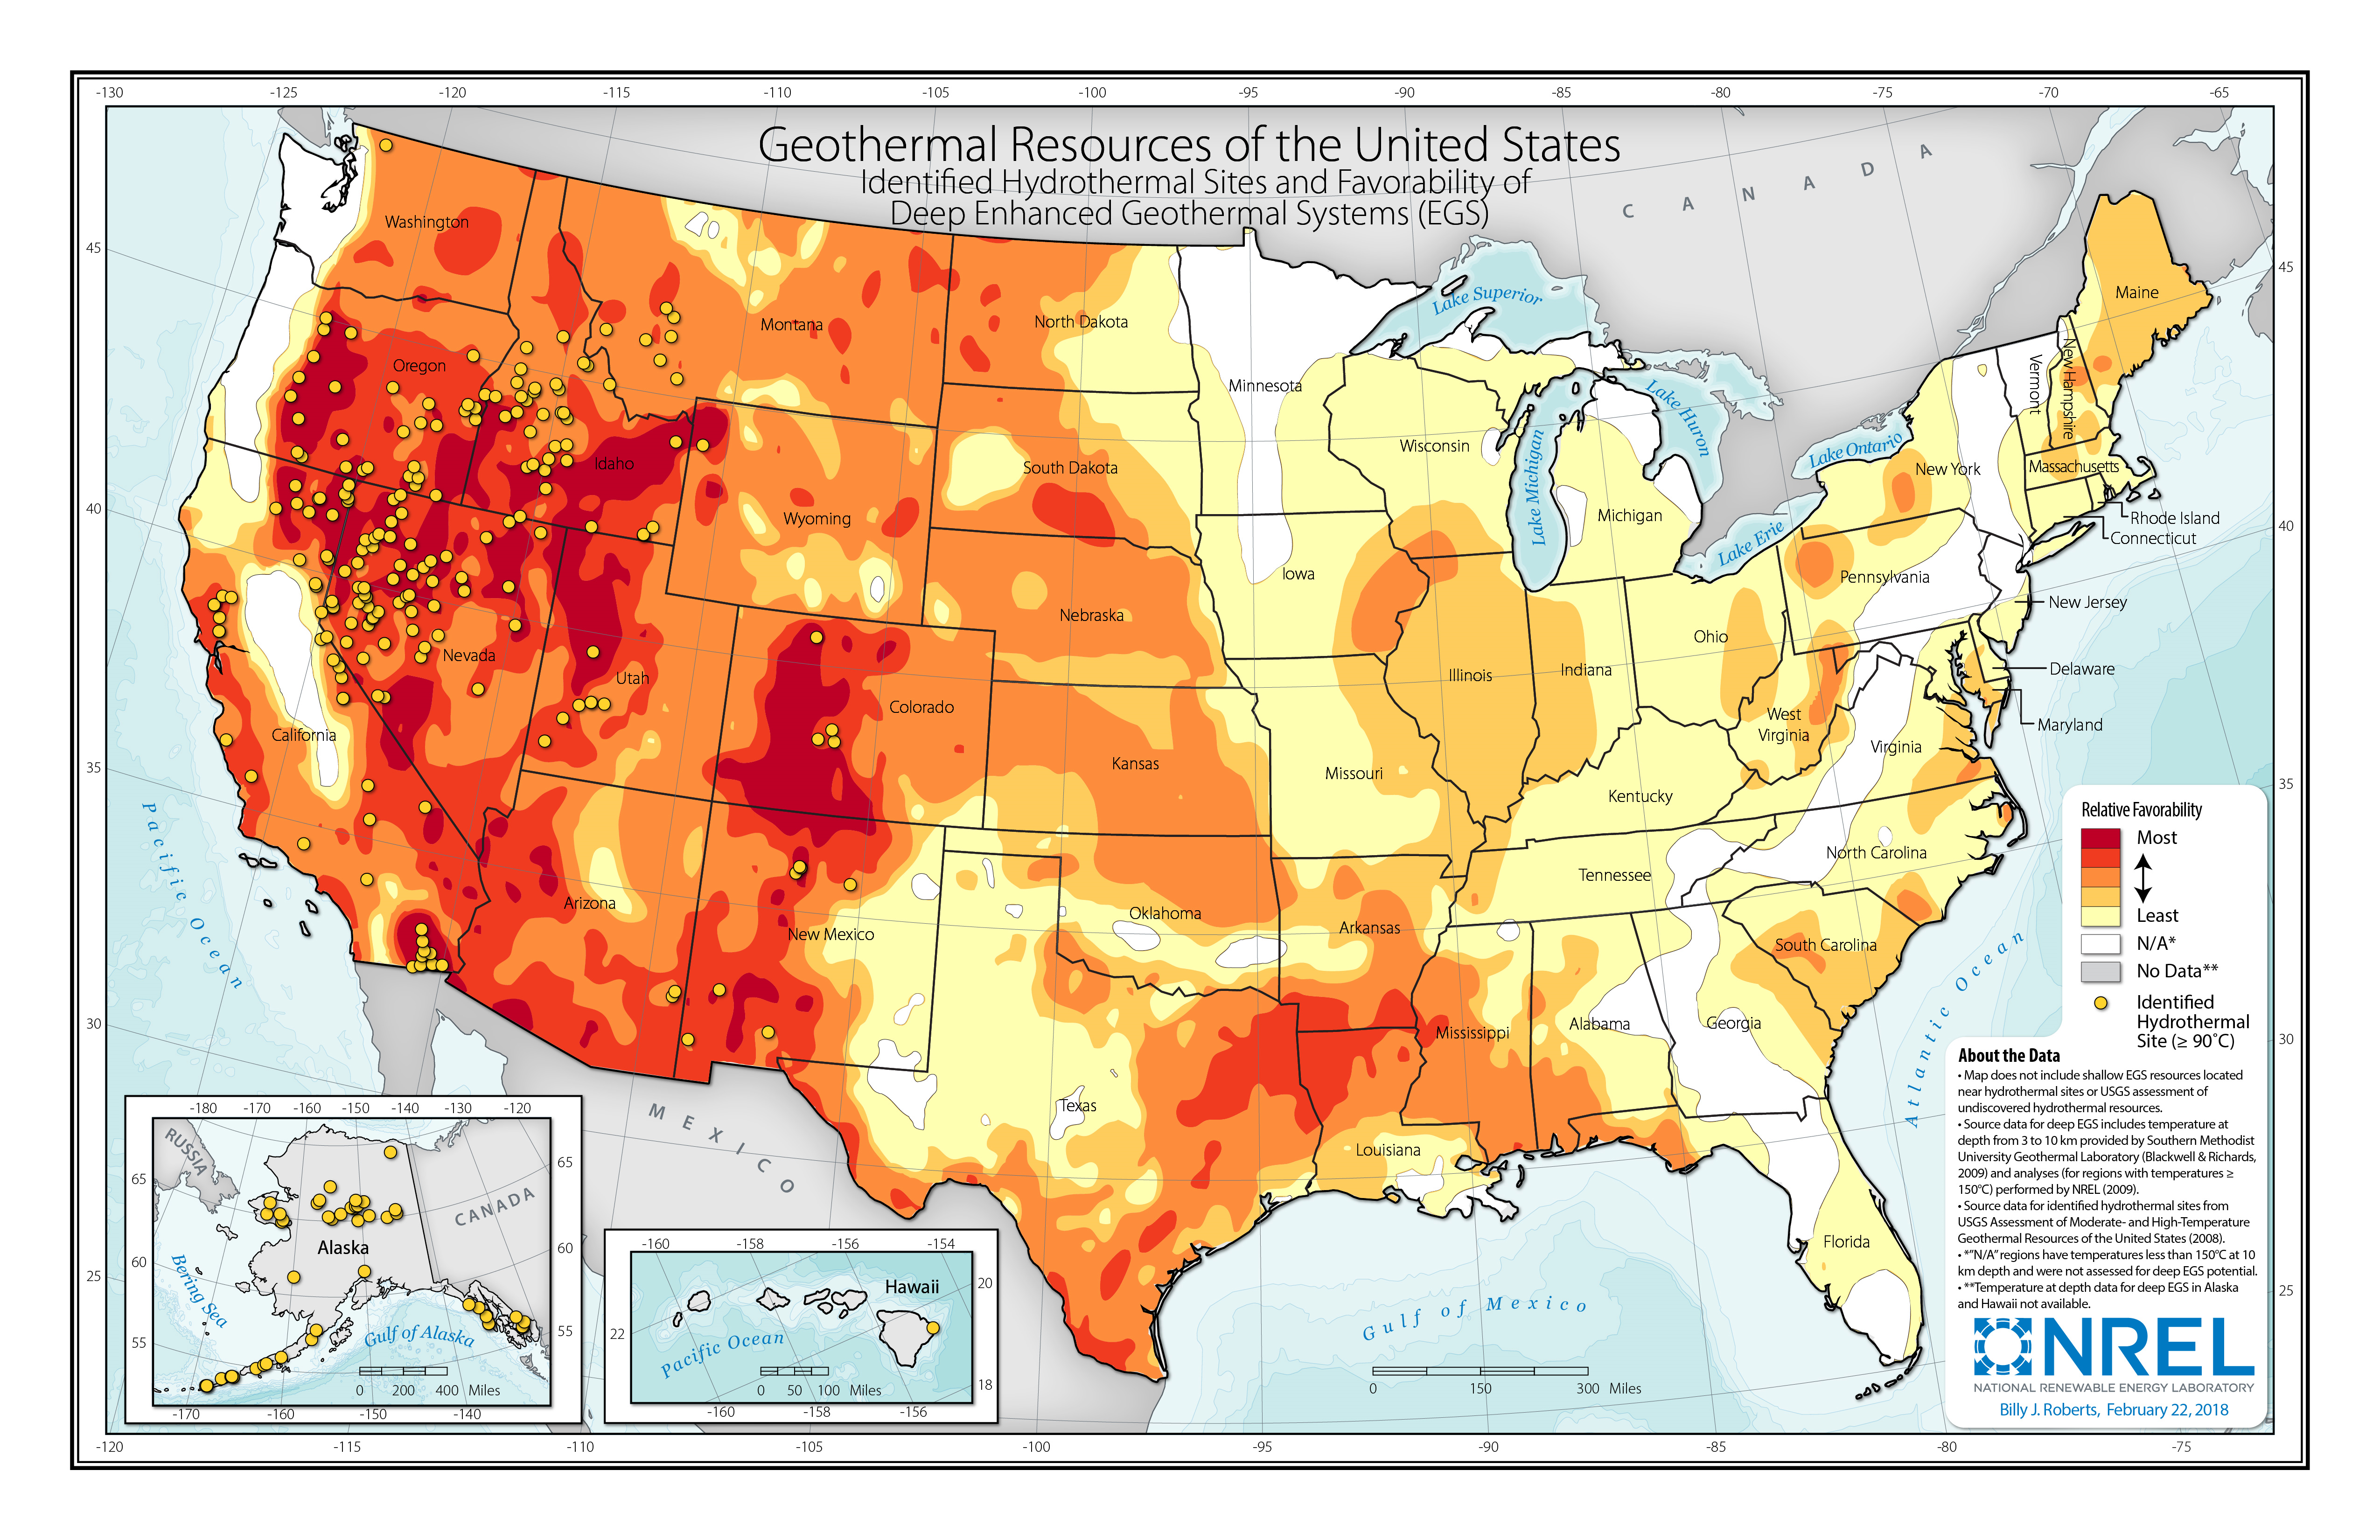
Map of identified hydrothermal sites and favorability of deep EGS in the United States
The EGS resource potential is concentrated in the western United States, but technology innovations as described in the Advanced Scenario would increase potential beyond the western United States. The total recoverable potential is greater than 100,000 MW: 1,493 MW of NF-EGS and the remainder from deep EGS. The NF-EGS resource potential is based on data from the USGS for EGS potential on the periphery of select identified hydrothermal sites (Augustine et al., 2019). The deep EGS resource potential ((Roberts, 2018); (Augustine, 2016)) is based on Southern Methodist University Geothermal Lab temperature-at-depth maps and the methodology is from (MIT, 2006). The deep EGS favorability map above and many other geothermal resource maps can be created with NREL's Geothermal Prospector tool.
Summary of Technology Innovation by Scenario (2030)
Technology Description: Drilling efficiency improvements (e.g., using mechanical specific energy with polycrystalline diamond compact bits and limiting bit dysfunction leads to longer bit life) result in minor decreases in drilling costs and little to no timeline reduction.
Justification: Substantial increases in drilling ROP are unlikely without wider adoption of oil and gas technologies and new bit innovations.
Technology Description: Current well stimulation techniques do not consistently generate adequate economic flow rates of sustained flow from unsuccessful wells leading to little to no improvement of drilling success rate or CAPEX reduction.
Justification: Stimulation is cost-prohibitive and lacks zonal isolation. Both the precision and scale of stimulation must improve.
Technology Description: ROP and bit life are doubled. Timelines and consumption of drilling materials are reduced.
Justification: Cost modeling of drilling improvements along with limited successful field demonstrations and abundant oil and gas experience confirm this level of advancement is achievable (Lowry et al., 2017b) (Lowry et al., 2017a); (Hackett et al., 2020).
Technology Description: As in the Conservative Scenario, stimulation techniques remain cost-prohibitive.
Justification: To remain consistent with the GeoVision report (DOE, 2019), cost modeling for stimulation technology has yet to be performed for a mid-case scenario. Additionally, successful deployment of EGS technology is modeled as coupled with significant drilling advancements as lower drilling costs and improved directional drilling in hard rock environments will likely help enable EGS reservoir development.
Technology Description: ROP and bit life are increased fourfold over the Conservative Scenario. Wells are constructed as mono-bore wells using expandable casing. The increased speeds result in significantly shorter timelines and lower consumption of drilling related materials.
Justification: Ongoing Advanced Research Projects Agency-Energy, Sandia National Laboratories, NREL, and other research (e.g., laser drilling and electric pulse research) is directed at reducing the cost, style, and duration of well drilling. Growing interest from the oil and gas sector is leading to knowledge transfer.
Technology Description: Stimulation success rate, control, and sustained flow rate advance to economic levels. EGS power plants are built with 100 MW of capacity. Permitting timelines have been reduced to reflect anticipated permit streamlining effects of a National Renewable Energy Coordination Office (RECO), as created in the 2020 Energy Act.
Justification: Ongoing EGS Collab, FORGE initiative, and other U.S. Department of Energy (DOE) Geothermal Technologies Office-sponsored research is demonstrating stimulation techniques in hard rock environments, including hydraulic shearing, zonal isolation, and other techniques. Also, EGS developments are not resource-constrained, so larger plants will be more economical to build and operate.
Performance Assumptions by Scenario
| Scenario | Rate of Penetration (ft/hr) | Bit Life (hr) | EGS Flow Rate (kg/s) |
|---|---|---|---|
| Conservative (2018) | 25 | 50 | 40 |
| Moderate | 50 | 100 | 40 |
| Advanced | 100 | 200 | 80 flash/110 binary |
Hydrothermal geothermal technologies encompass technologies for exploring for the resource, drilling to access the resource, and building power plants to convert geothermal energy to electricity. Technology costs depend heavily on the hydrothermal resource temperature and well productivity and depth, so much so that project costs are site-specific and a "typical" cost applied to any given site would be inaccurate. The 2022 ATB uses scenarios developed by the DOE Geothermal Technologies Office (Mines, 2013) for representative binary and flash hydrothermal power plant technologies.
The first scenario assumes a 175°C resource at a depth of 1.5 km with wells producing an average of 110 kg/s of geothermal brine supplied to a 30-MWe binary (organic Rankine cycle) power plant. The second scenario assumes a 225°C resource at a depth of 2.5 km with wells producing 80 kg/s of geothermal brine supplied to a 40-MWe dual-flash plant. These are mid-grade or "typical" temperatures and depths for binary and flash hydrothermal projects.
The 2022 ATB representative technologies fall in the middle to low end of the hydrothermal resources cost estimates typically deployed in Regional Energy Deployment System (ReEDS) model runs.
As with costs for projects that use hydrothermal resources, EGS resource project costs depend so heavily on the hydrothermal resource temperature and well productivity and depth that project costs are site-specific. The 2022 ATB uses scenarios developed by the DOE Geothermal Technologies Office (Mines, 2013) for representative binary and flash EGS power plants assuming current (immature) EGS technology performance metrics. The first scenario assumes a 175°C resource at a depth of 3 km with wells producing an average of 40 kg/s of geothermal brine supplied to a 25-MWe binary (organic Rankine cycle) power plant. The second scenario assumes a 250°C resource at a depth of 3.5 km with wells producing 40 kg/s of geothermal brine supplied to a 30-MWe dual-flash plant. These temperatures and depths are at the low-cost end of the EGS supply curve and would be some of the first developed.
This section describes the methodology to develop assumptions for CAPEX, O&M, and capacity factor. For standardized assumptions, see labor cost, regional cost variation, materials cost index, scale of industry, policies and regulations, and inflation.
The site-specific nature of geothermal plant cost, the relative maturity of hydrothermal plant technology, and the very early-stage development of EGS technologies make cost projections difficult. The GeoVision scenarios were based on bottom-up analysis of potential cost and performance improvements. The inputs for these scenarios were developed by the national laboratories as part of the GeoVision effort and were reviewed by industry experts.
The cost and performance estimates are calculated using Geothermal Electricity Technology Evaluation Model (GETEM), a bottom-up cost analysis tool that accounts for each phase of development of a geothermal plant as follows:
Definition: For the ATB—and based on (EIA, 2016) and GETEM component cost calculations—the geothermal plant envelope is defined to include:
In the 2022 ATB, CAPEX is shown for six representative plants. CAPEX estimates for all hydrothermal NF-EGS potential result in a CAPEX range that is much broader than that shown in the ATB. It is unlikely that all the resource potential will be developed because of the high costs for some sites. Effects of regional cost variation and distance-based spur line costs are not estimated.
CAPEX in the ATB does not represent regional cost variants ( CapRegMult ) associated with labor rates, material costs, or other factors (CapRegMult = 1).
CAPEX in the ATB does not include geographically determined spur line (GCC) costs from plant to transmission grid (GCC = 0).
Base Year: GETEM inputs are derived from the Business-as-Usual scenario from the GeoVision report ((DOE, 2019), (Augustine et al., 2019)). Costs are for new or greenfield hydrothermal projects—not for redrilling or additional development/capacity additions at an existing site. The following chart shows historical CAPEX and LCOE for geothermal, including data from the International Renewable Energy Agency (IRENA, 2021).
Future Years: Projection of future geothermal plant CAPEX for three scenarios are derived from modeled costs in the GeoVision report (DOE, 2019) as follows:
Use the following table to view the components of CAPEX.
Components of CAPEX
Definition: Fixed O&M (FOM) costs represent average annual fixed expenditures (and depend on rated capacity) required to operate and maintain a hydrothermal plant over its lifetime of 30 years (plant and reservoir), including:
Base Year: GETEM is used to estimate FOM for each of the six representative plants. FOM for NF-EGS and EGS are equivalent. For the 2022 ATB, base year FOM costs are decreased by 23%. This change is supported by proprietary geothermal industry FOM data.
Future Years: Future FOM cost reductions are based on results from the GeoVision Technology Improvement scenario (DOE, 2019) and are described in detail by Augustine, Ho, and Blair (Augustine et al., 2019).
Use the following table to view the components of operating expenditures.
Components of Operating Expenditures
Definition: Geothermal plant capacity factor is influenced by diurnal and seasonal air temperature variation (for air-cooled plants), technology (e.g., binary or flash), downtime, and internal plant energy losses.
Estimates of capacity factor for geothermal plants in the ATB represent typical operation.
Base Year: The capacity factor estimates are developed using GETEM at typical design air temperature and are based on design plant capacity net losses. An additional reduction is applied to approximate potential variability that is due to seasonal temperature effects.
Some geothermal plants have experienced year-on-year reductions in energy production, but this is not consistent across all plants. No approximation of long-term degradation of energy output is assumed.
Future Years: Capacity factors remain unchanged from the Base Year through 2050. Technology improvements are focused on CAPEX costs. The dispatch characteristics of these systems can be valuable to the electric system to manage changes in net electricity demand. Actual capacity factors will be influenced by the degree to which system operators call on geothermal plants to manage grid services. However, a constant dispatch profile is modeled in the ATB and no change over time is assumed.
The following references are specific to this page; for all references in this ATB, see References.
DOE. “GeoVision: Harnessing the Heat Beneath Our Feet.” Washington, D.C.: U.S. Department of Energy, May 2019. https://doi.org/10.15121/1572361.
Robins, Jody, Amanda Kolker, Francisco Flores-Espino, Will Pettitt, Brian Schmidt, Koenraad F. Beckers, Hannah Pauling, and Benjamin Anderson. “2021 U.S. Geothermal Power Production and District Heating Market Report.” Technical Report. Golden, CO: National Renewable Energy Laboratory, July 2021. https://www.nrel.gov/docs/fy21osti/78291.pdf.
MIT. “The Future of Geothermal Energy: Impact of Enhanced Geothermal Systems (EGS) on the United States in the 21st Century: An Assessment by an MIT-Led Interdisciplinary Panel.” Massachusetts Institute of Technology, 2006. https://www1.eere.energy.gov/geothermal/pdfs/egs_toc_front.pdf.
Augustine, Chad, Jonathan Ho, and Nate Blair. “GeoVision Analysis Supporting Task Force Report: Electric Sector Potential to Penetration.” Technical Report. Golden, CO: National Renewable Energy Laboratory, 2019. https://doi.org/10.2172/1524768.
Augustine, Chad. “Updates to Enhanced Geothermal System Resource Potential Estimate.” In GRC Transactions, 40:673–77. Sacramento, CA: Geothermal Resources Council, 2016. http://pubs.geothermal-library.org/lib/grc/1032382.pdf.
Roberts, Billy J. “Geothermal Resource of the United States: Identified Hydrothermal Sites and Favorability of Deep Enhanced Geothermal Systems (EGS).” Golden, CO: National Renewable Energy Laboratory, February 22, 2018. https://www.nrel.gov/gis/assets/images/geothermal-identified-hydrothermal-and-egs.jpg.
USGS. “Assessment of Moderate- and High-Temperature Geothermal Resources of the United States.” Menlo Park, CA: U.S. Geological Survey, 2008. https://pubs.usgs.gov/fs/2008/3082/pdf/fs2008-3082.pdf.
Lowry, Thomas S., John T. Finger, Charles R. Carrigan, Adam Foris, Mack B. Kennedy, Thomas F. Corbet, Christine A. Doughty, and Stephen Pye. “GeoVision Analysis Supporting Task Force Report: Reservoir Maintenance and Development.” Albuquerque, NM: Sandia National Laboratories, September 2017a. https://doi.org/10.2172/1394062.
Jain, Jayesh R., Gregory Ricks, Benjamin Baxter, Chaitanya Vempati, Volker Peters, Juan-Miguel Bilen, Reed Spencer, and Holger Stibbe. “A Step Change in Drill-Bit Technology with Self-Adjusting Polycrystalline-Diamond-Compact Bits.” Fort Worth, TX: Society of Petroleum Engineers, 2016. https://doi.org/https://doi.org/10.2118/178815-MS.
Teodoriu, Catalin. “Dynamic Casing Shoe While Drilling: A Smart Drilling Concept for Future Monobore Technologies.” Journal of Natural Gas Science and Engineering 27, no. 3 (November 2015): 1279–86. https://doi.org/10.1016/j.jngse.2015.05.021.
DOE. “Geothermal Technical Working Paper No. 4: Hydraulic Stimulation.” Washington, D.C.: U.S. Department of Energy, 2016. https://doi.org/10.2172/1394062.
McClure, Mark W., and Roland N. Horne. “An Investigation of Stimulation Mechanisms in Enhanced Geothermal Systems.” International Journal of Rock Mechanics and Mining Sciences 27 (December 2014): 242–60. https://doi.org/10.1016/j.ijrmms.2014.07.011.
Lukawski, Maciej Z., Brian J. Anderson, Augustine Chad, Louis E. Capuano Jr., Koenraad F. Beckers, Bill Livesay, and Jefferson W. Tester. “Cost Analysis of Oil, Gas, and Geothermal Well Drilling.” Journal of Petroleum Science and Engineering 118 (June 2014): 1–14. https://doi.org/10.1016/j.petrol.2014.03.012.
Li, Tao. “Solid Expandable Tubular Patching Technique for High-Temperature and High-Pressure Casing Damaged Wells.” Petroleum Exploration and Development 42, no. 3 (June 2015): 408–13. https://doi.org/10.1016/S1876-3804(15)30032-X.
Lowry, Thomas S., Adam Foris, John T. Finger, Stephen Pye, and Douglas A. Blankenship. “Implications of Drilling Technology Improvements on the Availability of Exploitable EGS Resources.” In Proceedings. Stanford, CA: Stanford University, 2017b. https://pangea.stanford.edu/ERE/pdf/IGAstandard/SGW/2017/Lowry.pdf.
Kalinina, Elena A., Teklu Hadgu, Katherine A. Klise, and Thomas S. Lowry. “Thermal Performance of Directional Wells for EGS Heat Extraction.” In Proceedings. Stanford, CA: Stanford University, 2014. https://pangea.stanford.edu/ERE/pdf/IGAstandard/SGW/2014/Kalinina.pdf.
Hackett, Logan, Douglas Blankenship, and Ann Robertson-Tai. “Analysis of Drilling Performance Using PDC Bits, Fallon FORGE Well 21-31.” In Proceedings. Stanford, CA: Stanford University, 2020. https://pangea.stanford.edu/ERE/db/GeoConf/papers/SGW/2020/Hackett.pdf.
Mines, Greg. “Geothermal Electricity Technology Evaluation Model (GETEM).” Presented at the Geothermal Technologies Office 2013 Peer Review, Washington, D.C., 22 2013. https://energy.gov/sites/prod/files/2014/02/f7/mines_getem_peer2013.pdf.
EIA. “Capital Cost Estimates for Utility Scale Electricity Generating Plants.” Washington, D.C.: U.S. Energy Information Administration, 2016. https://www.eia.gov/analysis/studies/powerplants/capitalcost/pdf/capcost_assumption.pdf.
IRENA. “Renewable Power Generation Costs in 2020.” Technical Report. Abu Dhabi, United Arab Emirates: International Renewable Energy Agency, June 2021. https://www.irena.org/publications/2021/Jun/Renewable-Power-Costs-in-2020.
EIA. “Annual Energy Outlook 2015 with Projections to 2040.” Annual Energy Outlook. Washington, D.C.: U.S. Energy Information Administration, 2015. https://www.eia.gov/outlooks/archive/aeo15/.
Developed with funding from the U.S. Department of Energy’s Office of Energy Efficiency and Renewable Energy.